Viewing Mapping Manager Dashboard
The Mapping Manager Dashboard displays metrics that help you analyze and track your projects and mappings. It presents this information using charts and graphs.
To access Mapping Manager Dashboard, follow these steps:
- Go to Application Menu > Data Catalog > Mapping Manager.
- Click the Mapping Manager Dashboard pane.
- Statistics: It displays a snapshot of statistics related to mapping projects.
- Mapping Summary: It displays the number of mappings in each project.
- Mapping Status: It displays the number of mappings in each mapping state.
- Proactive Impact Analysis - Truncation Impacts: It displays the number of instances of source truncation in each project.
- Project Overview: It displays the number of subjects, mappings, and assigned users in each project.
- Mapping Classification: It displays the number of active, archived, and published mappings in each project.
- Mapping Assignments: It displays the number of designers, approvers, developers, and testers assigned to mappings
- Sources/Targets Not Mapped: It displays the number of sources and targets not mapped in each project.
- Test Case Status: It displays the number of test cases under a test case status.
- Project Test Cases: It displays the number of test cases in each project.
- User Test Cases: It displays the number of test cases created by each user.
The Mapping Manager Dashboard appears.
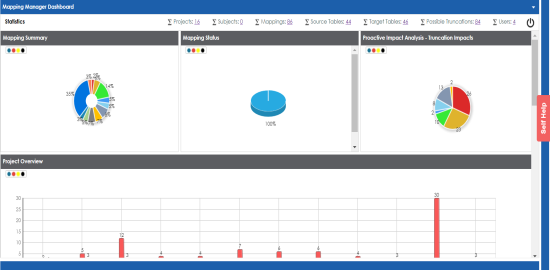
It displays the following panes:
Statistics
The Statistics pane displays the total number of projects, subjects, mappings, source tables, target tables, possible truncations, and users. For example, in the following image there are sixteen projects, eighty-six mappings, forty-four source tables, forty-six target tables, eighty-four possible truncations, and four users.

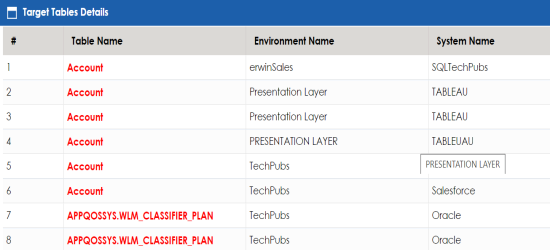
You can click the hyperlink to view further details. For example, if you click the hyperlink for the Target Tables. The Target Table Details page appears.
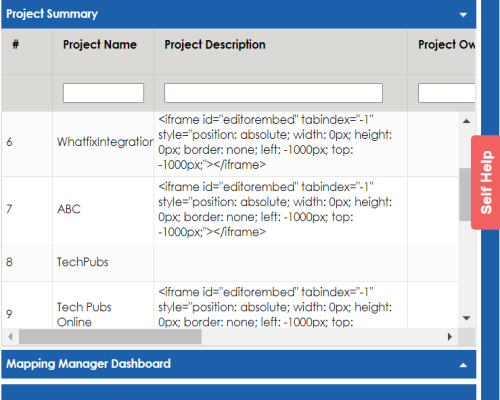
Mapping Summary
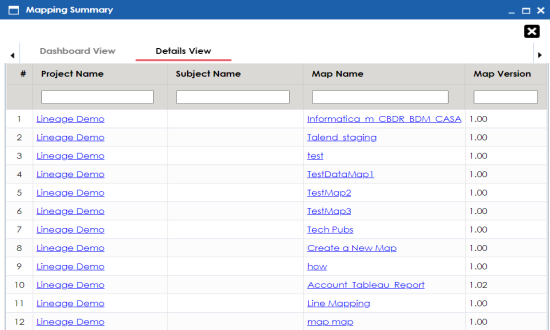
The Mapping Summary pane displays the number of mappings in each project in a pie chart. To open the chart in the Dashboard View, click the pie-chart.
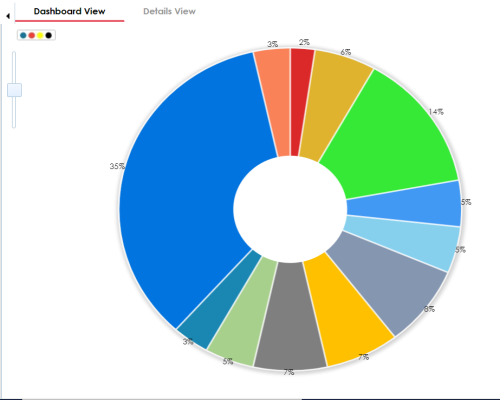
Each slice of the pie chart corresponds to a project. You can drill down and view detailed information in the list format. To view detailed information about mappings in a project, click a slice. The Details View tab opens. It displays project name, subject name, map name, and map version.
Mapping Status
The Mapping Status pane displays the number of mappings under each mapping state in a pie chart. By default there are two mapping states, In Progress and Approved. You can create your own mapping states depending on your requirements. For more information on creating mapping states, refer to the Configuring Mapping State Settings topic.
To open the chart in the Dashboard View, click the pie chart.
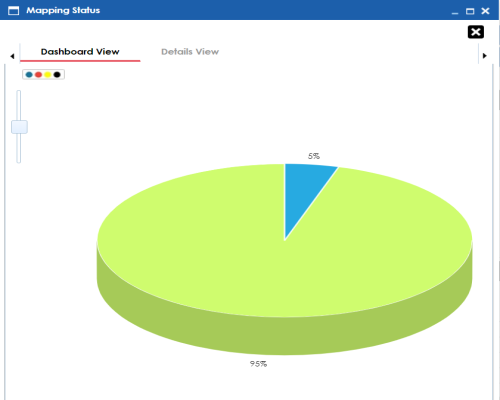
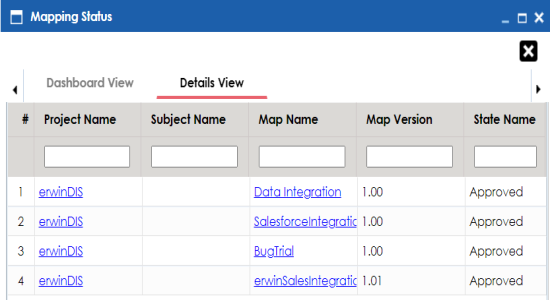
Each slice corresponds to a mapping state. You can drill down and view detailed information in the list format. To view detailed information about maps in a mapping state, click a slice of the pie-chart.
Proactive Impact Analysis - Truncation Impacts
The Proactive Impact Analysis - Truncation Impacts pane displays the number of instances where the target column length is smaller than the source column length in each project in a pie-chart. To open the chart in the Dashboard View, click the pie chart.
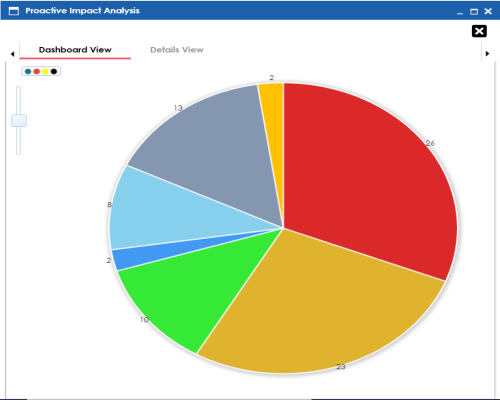
Each slice of the pie chart corresponds to a project. You can drill down and view detailed information in the list format.
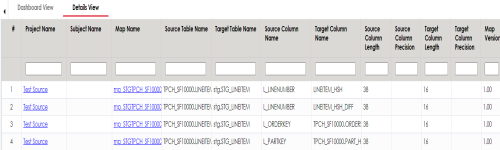
To view detailed information about truncated sources in a project, click a slice of the pie chart. The Details View tab opens. It displays project name, subject name, map name, source and target column names.
Project Overview
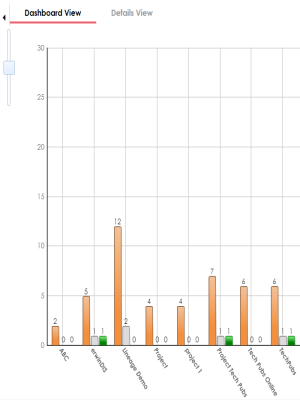
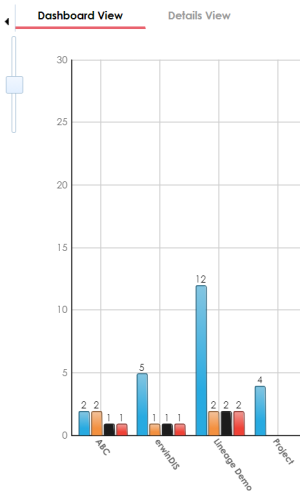
The Project Overview pane displays the number of subjects, mappings, and assigned users in each project in a bar graph. To open bar graph in the Dashboard View, click the bar graph.
Each set of three bars corresponds to a project. You can view detailed information in the list format. To view the Detailed information about mappings, subjects, or assigned users of a project click the corresponding bar. For example, if you click the mappings bar then the Mappings tab opens.
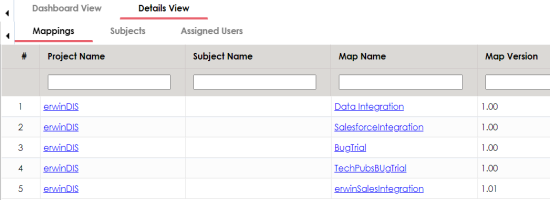
To view a list of subjects, click the Subjects tab.
To view a list of the assigned users, click the Assigned Users tab.
Mapping Classification
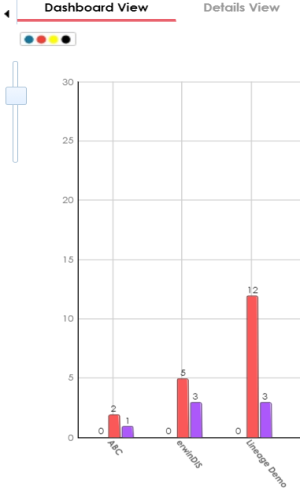
The Mapping Classification pane displays the number of active, archived, and published mappings in each project in a bar graph. To open the bar graph in the Dashboard View, click the bar graph.
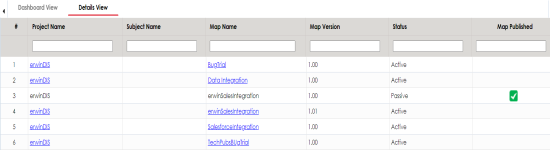
Each set of three bars corresponds to a project. You can drill down and view detailed information. To view detailed information about status of mappings in a project, click a bar. The Details View tab opens. It displays project name, subject name, map name, map version, and status.
Mapping Assignments
The Mapping Assignments pane displays the number of designers, approvers, developers, and testers assigned to mappings in each project in a bar graph. For more information on mapping assignments, refer to the Assigning Mapping Specifications to Users topic.
To open the bar graph in the Dashboard View, click the bar graph.
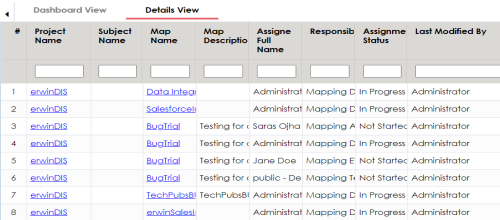
Each set of three bars corresponds to a project. You can drill down and view detailed information in the list format. To view detailed information about mapping assignments in a project, click a bar. The Detail View tab opens. It displays project name, subject name, map name, assigned user's full name, and assignment status.
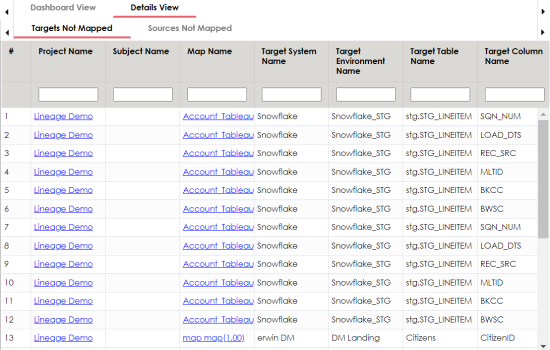
Sources/Targets Not Mapped
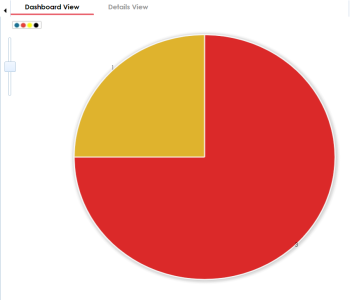
The Sources/Targets Not Mapped pane displays the number of sources and targets not mapped in each project in a bar graph. To open the bar graph in the Dashboard View, click the bar graph.
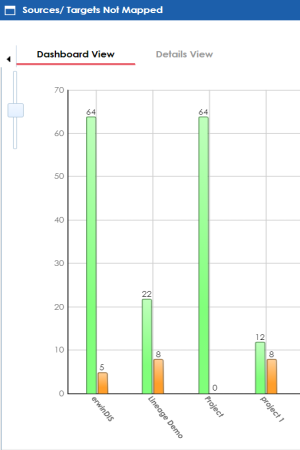
Each set of two bars corresponds to a project. You can drill down and view detailed information in the list format. To view the detailed information about sources and target not mapped in a project, click a bar. The Details View tab opens. It displays project name, map name, and target and source details.
Test Case Status
The Test Case Status pane displays the number of test cases under a test case status in a pie chart. To open the chart in the Dashboard View, click the pie chart.
Each slice of the pie chart corresponds to a test case status. You can drill down and view detailed information in the list format. To open the detailed information about test cases, click a slice. The Details View tab opens. It displays project name, map name, and test case names.
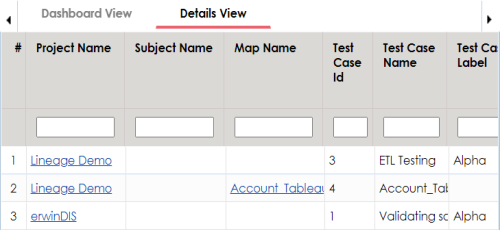
Project Test Cases
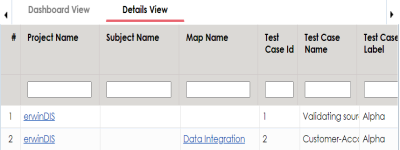
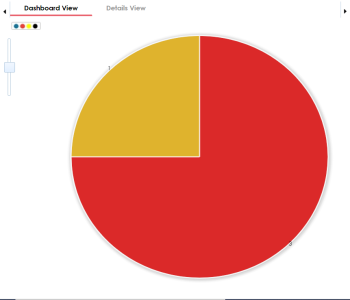
The Project Test Cases pane displays the number of test cases in each project in a pie-chart. To open the chart in the Dashboard View, click the pie chart.
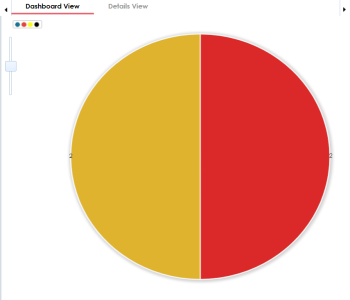
Each slice in the pie chart corresponds to a project. You can drill down and view detailed information in the list format.
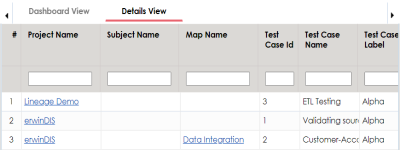
To view the detailed information about test cases in a project, click a slice of the pie chart. The Details View tab opens. It displays project name, subject name, map name, test case ID, test case name, and test case label.
User Test Cases
The User Test Cases pane displays the number of test cases created by each user in a pie-chart. To open the chart in the Dashboard View, click the pie chart.
Each slice of the pie chart corresponds to a user. You can drill down to view detailed information in the list format.
To view the detailed information about test cases created by a user, click a slice of the pie-chart. The Details View tab opens. It displays project name, subject name, map name, test case ID, test case name, and test case label.
|
|
|
Copyright © 2021 erwin, Inc. All rights reserved. Copyright © 2021 Quest Software Inc. All rights reserved. All trademarks, trade names, service marks, and logos referenced herein belong to their respective companies. |